
Lead
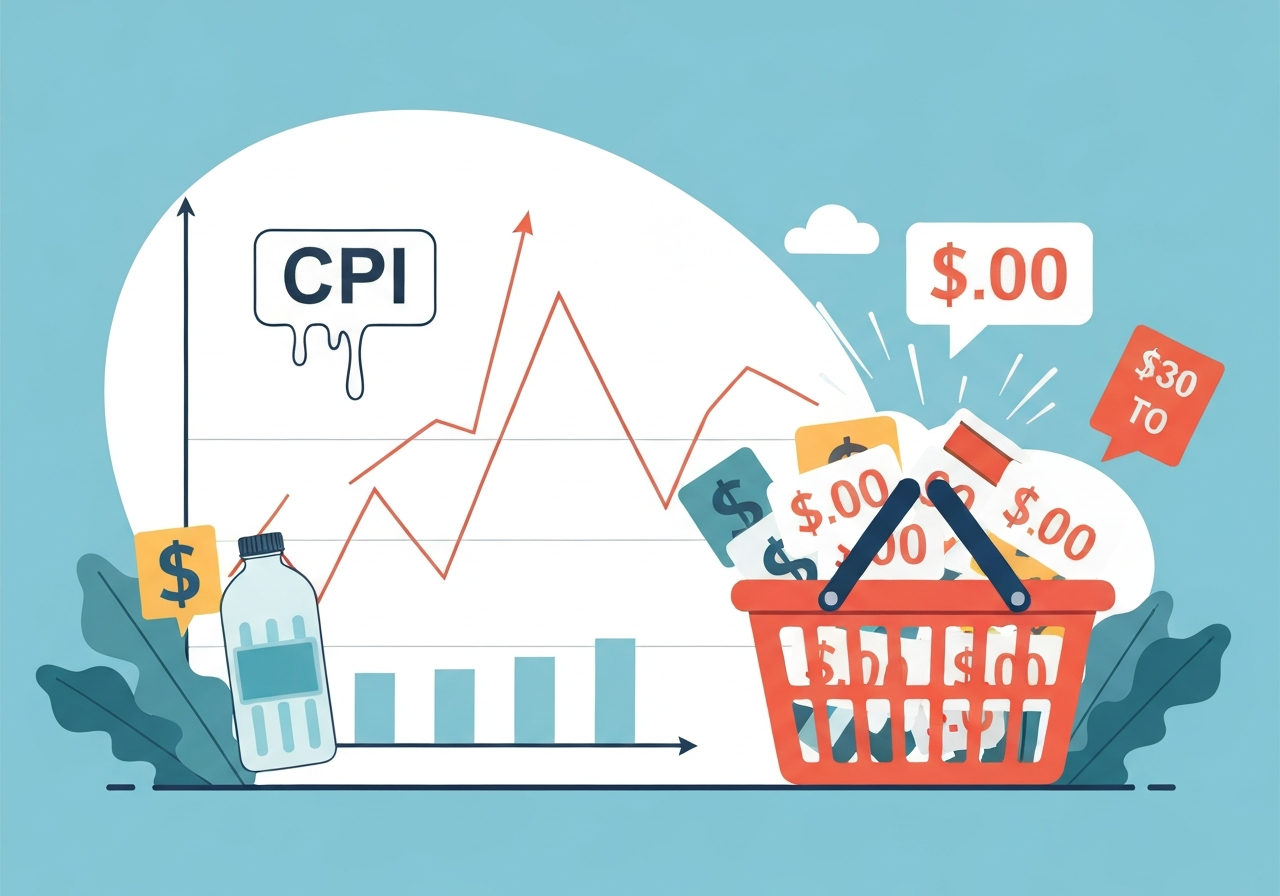
The Bureau of Labor Statistics’ February Consumer Price Index, released Wednesday, showed U.S. headline inflation steady at 2.4 percent year-over-year and up 0.3 percent for the month, with “core” inflation (excluding food and energy) at 2.5 percent annually and 0.2 percent monthly. The report covers prices through Feb. 28 — the day U.S. and Israeli strikes on Iran began — so the figures do not reflect the subsequent spike in oil and gasoline that has followed the conflict. Policymakers say the energy shock raises the risk that upward pressure on prices will persist, complicating the Federal Reserve’s path for interest-rate cuts. At the same time, signs of labor-market softening — employers cut 92,000 jobs in February and unemployment rose to 4.4 percent — add a second policy tension point.
Key takeaways
- Headline CPI: +0.3 percent month-over-month in February and +2.4 percent year-over-year, unchanged from January’s annual pace.
- Core CPI (ex-food and energy): +0.2 percent month-over-month and +2.5 percent year-over-year in February.
- Food costs were an important driver: overall food rose 0.4 percent in February and 3.1 percent versus a year earlier; grocery prices were up 2.4 percent year-over-year.
- Energy: after a January decline, energy rose modestly in February (+0.6 percent); gasoline was +0.8 percent in the month but jumped sharply after the Feb. 28 strikes, with national pump averages reaching $3.58 by Wednesday.
- Housing/shelter remained a drag on headline monthly swings but rose 3.0 percent year-over-year; measurement lags from last fall’s federal shutdown still mute some shelter inflation signals.
- Trade and tariff-exposed goods stayed elevated: appliances rose about 2.9 percent year-over-year and audio equipment surged roughly 13.5 percent annually.
- Labor-market softening: payrolls fell by 92,000 in February and unemployment edged up to 4.4 percent, complicating the Fed’s dual mandate choices.
Background
February’s CPI arrives at a fraught inflection: the report captures price movements through the day U.S. and Israeli strikes expanded the conflict with Iran on Feb. 28, but it does not include the subsequent, rapid moves in oil and gasoline. The war has since amplified energy-market volatility, briefly pushing Brent crude to roughly $119.50 a barrel and lifting average U.S. pump prices by double-digit percentages in the days after the strikes.
Beyond the recent geopolitical shock, U.S. price dynamics in 2024–26 have been shaped by two structural supply pressures: tariffs that raised the cost of many imported goods and tighter immigration enforcement and related labor shortages in services such as home health care and food service. Those forces have fed through gradually into consumer prices, complicating the Fed’s assessment of whether inflation is truly receding to its 2 percent goal.
Main event
The BLS report shows core price growth remains modest but persistent. On a 12-month basis core inflation was 2.5 percent, while headline inflation held at 2.4 percent — a pattern that signals continued broad-based pressure rather than a rapid fall back to target. Food categories were notable: grocery prices rose 0.4 percent in February (2.4 percent year-over-year for staples), and food away from home climbed 3.9 percent annually.
Energy costs ticked up in February after January’s fall: overall energy was +0.6 percent for the month and +0.5 percent year-over-year. Gasoline was +0.8 percent in February but moved sharply higher after late-month military strikes. Furniture was flat month-to-month yet 4.2 percent above last year; appliances and other tariff-exposed goods continued to show elevated gains.
Shelter — the largest CPI component for most households — rose 3.0 percent year-over-year in February, but the series shows measurement idiosyncrasies tied to data-collection gaps during last fall’s government shutdown. The Labor Department is still catching up on some surveys, a delay that has temporarily damped measured shelter inflation in official figures.
Analysis & implications
The immediate policy question is whether the recent energy surge will prove a short-lived supply blip or a persistent inflationary impulse. The Fed has maintained its policy rate range at 3.5–3.75 percent since January and policymakers are widely expected to hold again at next week’s meeting. But economists now expect the central bank to delay resuming rate cuts — many push the likely first cut from July to September — because energy-driven price rises can raise headline inflation even while growth cools.
Supply shocks create a classic dilemma for a central bank with a dual mandate. Higher oil prices lift transport, shipping and many commodity-dependent costs; if those effects bleed into wages or broader service prices, they can make inflation more entrenched. Conversely, sustained higher energy costs reduce real incomes and can depress consumer spending, tipping growth toward stagnation and job losses. That trade-off is heightening the risk that the Fed will “wait and see” until clearer trends emerge.
Quantitatively, some forecasters note the sensitivity of core inflation to oil: a sustained $10-per-barrel rise in crude is commonly estimated to raise core inflation by only a few basis points (roughly 0.05 percentage point) but can meaningfully slow GDP growth. Scenario analysis from major forecasters warns that if oil remains at or above $100 per barrel for many months, U.S. inflation could move materially higher and growth materially lower — a combination that may push headline inflation above 4 percent in 2026 under severe cases and lower real GDP growth compared with earlier projections.
Comparison & data
| Indicator | February reading (latest) |
|---|---|
| Headline CPI, year-over-year | 2.4% |
| Headline CPI, month-over-month | +0.3% |
| Core CPI, year-over-year | 2.5% |
| Core CPI, month-over-month | +0.2% |
| Payrolls (Feb.) | -92,000 jobs |
| Unemployment rate | 4.4% |
| Brent crude peak after strikes | ~$119.50 / barrel |
| U.S. national gasoline avg (Wed.) | $3.58 / gallon |
These figures show a CPI profile that was steady through February but vulnerable: shelter inflation remains positive and food costs are still rising, while the energy component — small in February’s numbers — has since accelerated. The jobs data point to a labor market that is cooling, which may blunt how high inflation eventually goes but also raises concerns about consumer resilience.
Reactions & quotes
Chicago Fed President Austan Goolsbee framed the policy dilemma succinctly, noting that simultaneous deterioration in jobs and inflation leaves unclear the “immediate response” the Fed should adopt. Policymakers are therefore more likely to require clearer evidence of durable disinflation before cutting rates.
“If the job market is getting worse and inflation is getting worse at the same time, it’s not obvious to me what the immediate response should be.”
Austan D. Goolsbee, Federal Reserve Bank of Chicago (Fed official)
Private-sector economists also warned that February’s CPI will look like an incomplete picture after the energy shock. RSM’s chief economist said the post-strike oil and gasoline surge makes February’s report less useful for near-term forecasting, and some forecasters projected a marked upward move in March inflation because of higher energy prices.
“Forward-looking investors should anticipate an increase in topline inflation of 0.6% in March due to oil and gasoline moves,”
Joe Brusuelas, RSM (private sector economist)
Fuel-price analysts and consumer groups underscored the immediate strain on households. GasBuddy’s lead petroleum analyst highlighted how daily national spending on gasoline has risen sharply since the strikes, pressuring budgets even before other inflation channels kick in.
“Americans today are going to spend roughly $200 million more a day on gasoline than they were eight days ago.”
Patrick De Haan, GasBuddy (industry data analyst)
Unconfirmed
- Duration and ultimate economic cost of the U.S.-Iran conflict: current outcomes depend heavily on how long hostilities and shipping disruptions persist (unconfirmed as of this report).
- Exact magnitude of March CPI impact: estimates that March headline inflation will jump by a specific figure (for example, +0.6 percent) are model-based projections, not BLS-confirmed data.
- Long-term pass-through of tariffs and immigration-related labor changes into core inflation: research shows gradual effects, but the full magnitude and timing remain subject to revision.
Bottom line
February’s CPI data showed inflation broadly steady before the dramatic geopolitical events at month-end. That gave the Fed little reason in mid-March to accelerate rate reductions; instead, officials are likely to hold policy while they assess whether the energy-driven price impulse will be fleeting or persistent.
For markets and households the key variables to watch are oil prices, pump prices, and incoming data on consumer spending and shelter costs. If energy prices remain elevated for months, the economy faces the twin risks of higher inflation and weaker growth, which would force a harder policy trade-off for the Fed and increase the odds of an economic slowdown.
Sources
- The New York Times — Live coverage (media)
- Bureau of Labor Statistics — CPI release and tables (official government data)
- GasBuddy — Fuel price data and analysis (industry data)
- AAA — National weekly gas-price averages (industry data)
- Federal Reserve — Policy statements and meeting calendar (official central bank)