
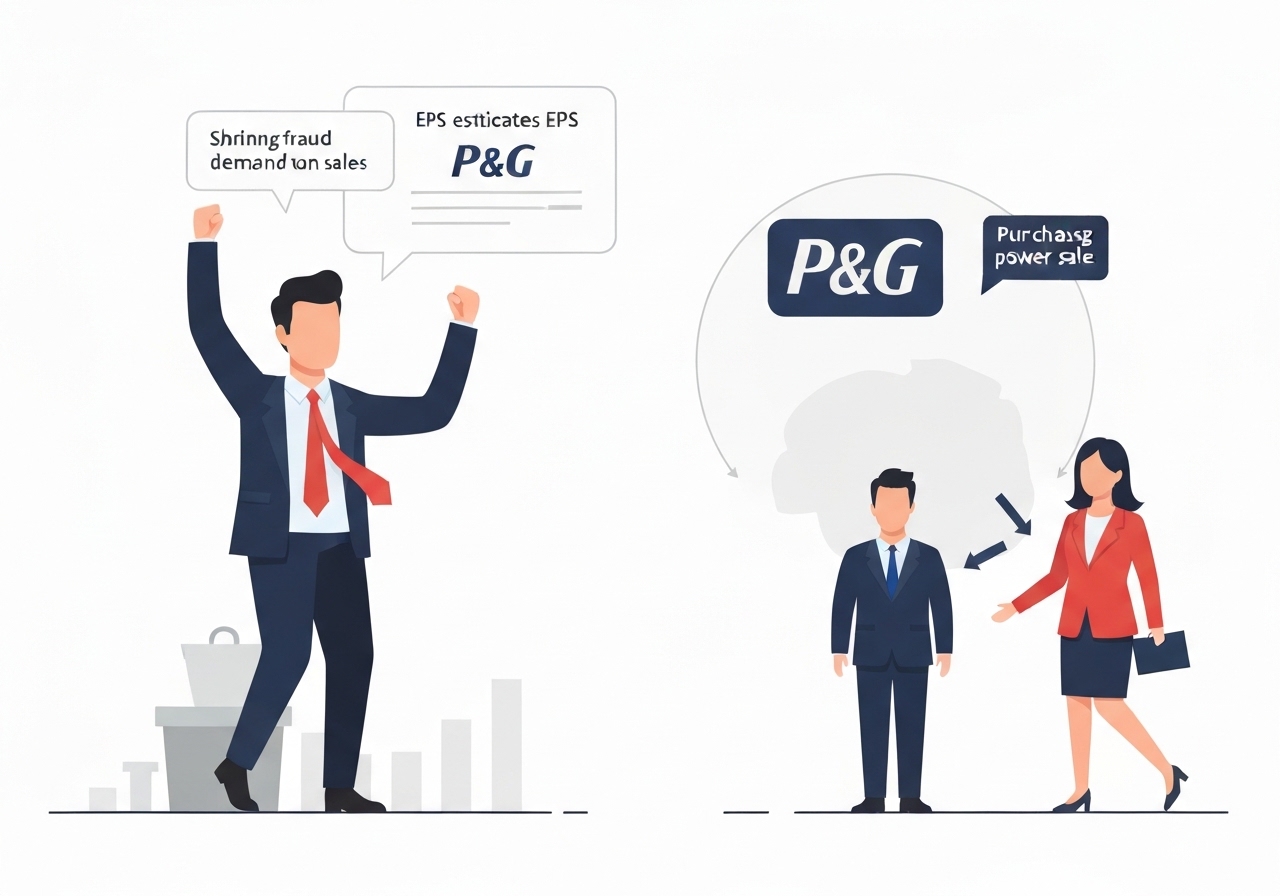
Procter & Gamble reported fiscal second-quarter results on Jan. 22, 2026, delivering adjusted earnings per share above analyst expectations while flagging softer consumer demand in key categories. Adjusted EPS came in at $1.88 versus the $1.86 consensus, but revenue missed slightly at $22.21 billion compared with $22.28 billion expected. The company said restructuring charges prompted a narrower fiscal 2026 EPS growth outlook of 1%–6%, down from a prior 3%–9% range, while reiterating its sales-growth guidance. Shares fell about 1% in premarket trading following the release.
Key Takeaways
- Adjusted EPS: $1.88, beating the LSEG analyst consensus of $1.86 for the quarter.
- Revenue: $22.21 billion, slightly below the $22.28 billion expected; net sales rose 1% year-over-year.
- Net income attributable to the company: $4.32 billion, or $1.78 per share, down from $4.63 billion ($1.88) a year earlier.
- Organic sales were flat for the quarter; the company reported a 1% decline in volume overall, excluding pricing effects.
- Three of five business segments saw volume contractions: baby/feminine/family care (-5%), grooming (-2%), health-care (-1%); fabric & home care was flat and beauty grew +3%.
- Fiscal 2026 EPS-growth guidance trimmed to 1%–6% from 3%–9%, attributed to higher restructuring charges; sales outlook unchanged.
- Market reaction: shares traded down roughly 1% premarket amid the mixed results and guidance revision.
Background
Procter & Gamble, a leading consumer-packaged-goods company with household brands across grooming, baby care, beauty, home care and health-care, regularly reports results that investors parse for both volume trends and pricing power. In recent years the sector has faced volatile input costs and shifting consumer spending patterns as inflation pressured household budgets. Against that backdrop, companies including P&G have balanced price increases, promotions and cost actions to protect margins.
Volume — the metric that strips out pricing to show underlying demand — has emerged as a key indicator for consumer names. P&G’s performance matters not only for its own valuation but as a barometer for broader consumer-health and household-product demand, because its brands (Gillette, Pampers, Tide, Charmin, Oral-B, etc.) are staples across geographies. Analysts and investors therefore watch volume, organic sales and guidance changes closely to distinguish temporary noise from structural shifts.
Main Event
For the fiscal second quarter, P&G reported adjusted earnings that marginally exceeded analyst expectations while revenue missed the consensus. The company said net income attributable to the firm was $4.32 billion, or $1.78 per share, down from $4.63 billion a year earlier. Excluding items such as restructuring costs, adjusted EPS was $1.88, compared with the $1.86 LSEG consensus.
Net sales rose 1% to $22.21 billion, but organic sales — which remove currency swings, acquisitions and divestitures — were essentially flat. Management highlighted a 1% overall decline in volume, noting that three of five segments reported volume contractions. The baby, feminine and family care category led declines with volume down 5%, citing particularly tough year-ago comparisons for family care products.
Grooming, which includes the Gillette and Venus razor franchises, saw a 2% volume decline, while the health-care segment (Oral-B, Vicks, Pepto-Bismol) was down 1%. Fabric & home care volumes were unchanged year-over-year and beauty was the lone growth area with volume rising 3%, driven by stronger hair-care demand. Management attributed the mix of results to demand softness in select categories and the ongoing impacts of consumer cost-sensitivity.
Alongside top-line details, P&G adjusted its fiscal 2026 EPS-growth outlook to 1%–6%, lowered from a previous 3%–9% range, explicitly tying the revision to higher-than-expected restructuring charges. The company reiterated its sales-growth outlook for the fiscal year and emphasized ongoing cost actions intended to support profits over time.
Analysis & Implications
The beat on adjusted EPS despite a revenue miss and flat organic sales suggests P&G is extracting more margin through pricing, mix or cost measures, but those gains have limits when volume softens. Volume is a forward-looking indicator for revenue sustainability; a 1% decline across the company, with deeper drops in baby/family and grooming, signals pockets of demand weakness that management will need to address.
For investors, the trimmed EPS-growth range matters because it signals near-term profit-pressure drivers beyond ordinary seasonality, particularly restructuring expenses. While cost actions are typically framed as long-term margin-enhancers, higher one-time charges reduce near-term earnings and create uncertainty about the pace of return on those investments.
From a consumer-behavior perspective, the pattern — flat organic sales, modest pricing offset, and selective volume declines — is consistent with households trading down, delaying nonessential purchases, or shifting to private-label alternatives. Beauty’s 3% volume growth, driven by hair care, suggests discretionary categories can still outperform if they deliver perceived value or innovation.
Globally, P&G’s mix of stable and weakening categories could influence competitors and retailers: suppliers may face renewed pressure to support promotions or innovate packaging sizes and formats that suit cost-conscious shoppers. Policy or macro shifts that affect inflation or purchasing power would also feed back into demand for staple and discretionary items, altering recovery timelines.
Comparison & Data
| Metric | Reported | Analyst Expectation (LSEG) | Year-ago / Change |
|---|---|---|---|
| Adjusted EPS | $1.88 | $1.86 | — |
| Revenue | $22.21B | $22.28B | Net sales +1% y/y |
| Net income | $4.32B ( $1.78 ) | — | Prior year $4.63B ( $1.88 ) |
| Overall volume | −1% | — | Three of five segments down |
The table highlights the narrow EPS beat against a slight revenue shortfall and reveals where demand is moving across segments. Volume declines in specific categories, rather than company-wide pricing weakness, are the primary cause of the tepid organic-sales result.
Reactions & Quotes
“We now expect net earnings per share growth in the range of 1% to 6% for fiscal 2026, reflecting higher restructuring charges.”
Procter & Gamble (official release)
“Adjusted EPS of $1.88 exceeded the $1.86 consensus, but flat organic sales and a 1% volume decline point to ongoing demand pressure in staples and grooming.”
Market summary compiled from LSEG analyst survey
“Shares traded roughly 1% lower in premarket activity as investors digested the guidance change and category-level volume trends.”
Market trading reports
Unconfirmed
- The precise breakdown and timing of the restructuring charges and expected one-time costs were not disclosed in the initial release and remain to be clarified.
- The relative contribution of private-label competition versus consumer downtrading to the baby/family care volume decline has not been independently verified.
- How quickly volume trends will normalize, if at all, depends on consumer spending and pricing dynamics that are still evolving.
Bottom Line
P&G delivered an adjusted-EPS beat but reported flat organic sales and a small overall volume decline, signaling uneven demand across its portfolio. Management’s decision to lower the EPS-growth range for fiscal 2026 because of higher restructuring charges introduces short-term earnings uncertainty, even as the company reiterates its sales outlook.
Investors should watch upcoming quarterly updates for clarity on the size and impact of restructuring costs, any directional change in category volumes (especially baby/family and grooming), and whether beauty’s outperformance can offset weakness elsewhere. For the consumer-products sector, P&G’s results underscore the fragile balance between pricing, promotion and demand in an inflation-affected environment.
Sources
- CNBC — News report summarizing the earnings release and market reaction (news).
- Procter & Gamble Investor Relations — Official company earnings releases and guidance (official).
- LSEG — Analyst consensus and data provider for EPS and revenue expectations (data provider).